Density plots
New to Plotly?
Plotly's Python library is free and open source! Get started by downloading the client and reading the primer.
You can set up Plotly to work in online or offline mode, or in jupyter notebooks.
We also have a quick-reference cheatsheet (new!) to help you get started!
Version Check
Note: 2D Density Plots are available in version 2.0.0+
Run pip install plotly --upgrade to update your Plotly version
```python deletable=true editable=true import plotly plotly.version
<!-- #region {"deletable": true, "editable": true} -->
#### 2D Histogram Contour Plot with Histogram Subplots
<!-- #endregion -->

```python deletable=true editable=true
import plotly.plotly as py
import plotly.figure_factory as ff

import numpy as np

t = np.linspace(-1, 1.2, 2000)
x = (t**3) + (0.3 * np.random.randn(2000))
y = (t**6) + (0.3 * np.random.randn(2000))

colorscale = ['#7A4579', '#D56073', 'rgb(236,158,105)', (1, 1, 0.2), (0.98,0.98,0.98)]

fig = ff.create_2d_density(
    x, y, colorscale=colorscale,
    hist_color='rgb(255, 237, 222)', point_size=3
)

py.iplot(fig, filename='histogram_subplots')
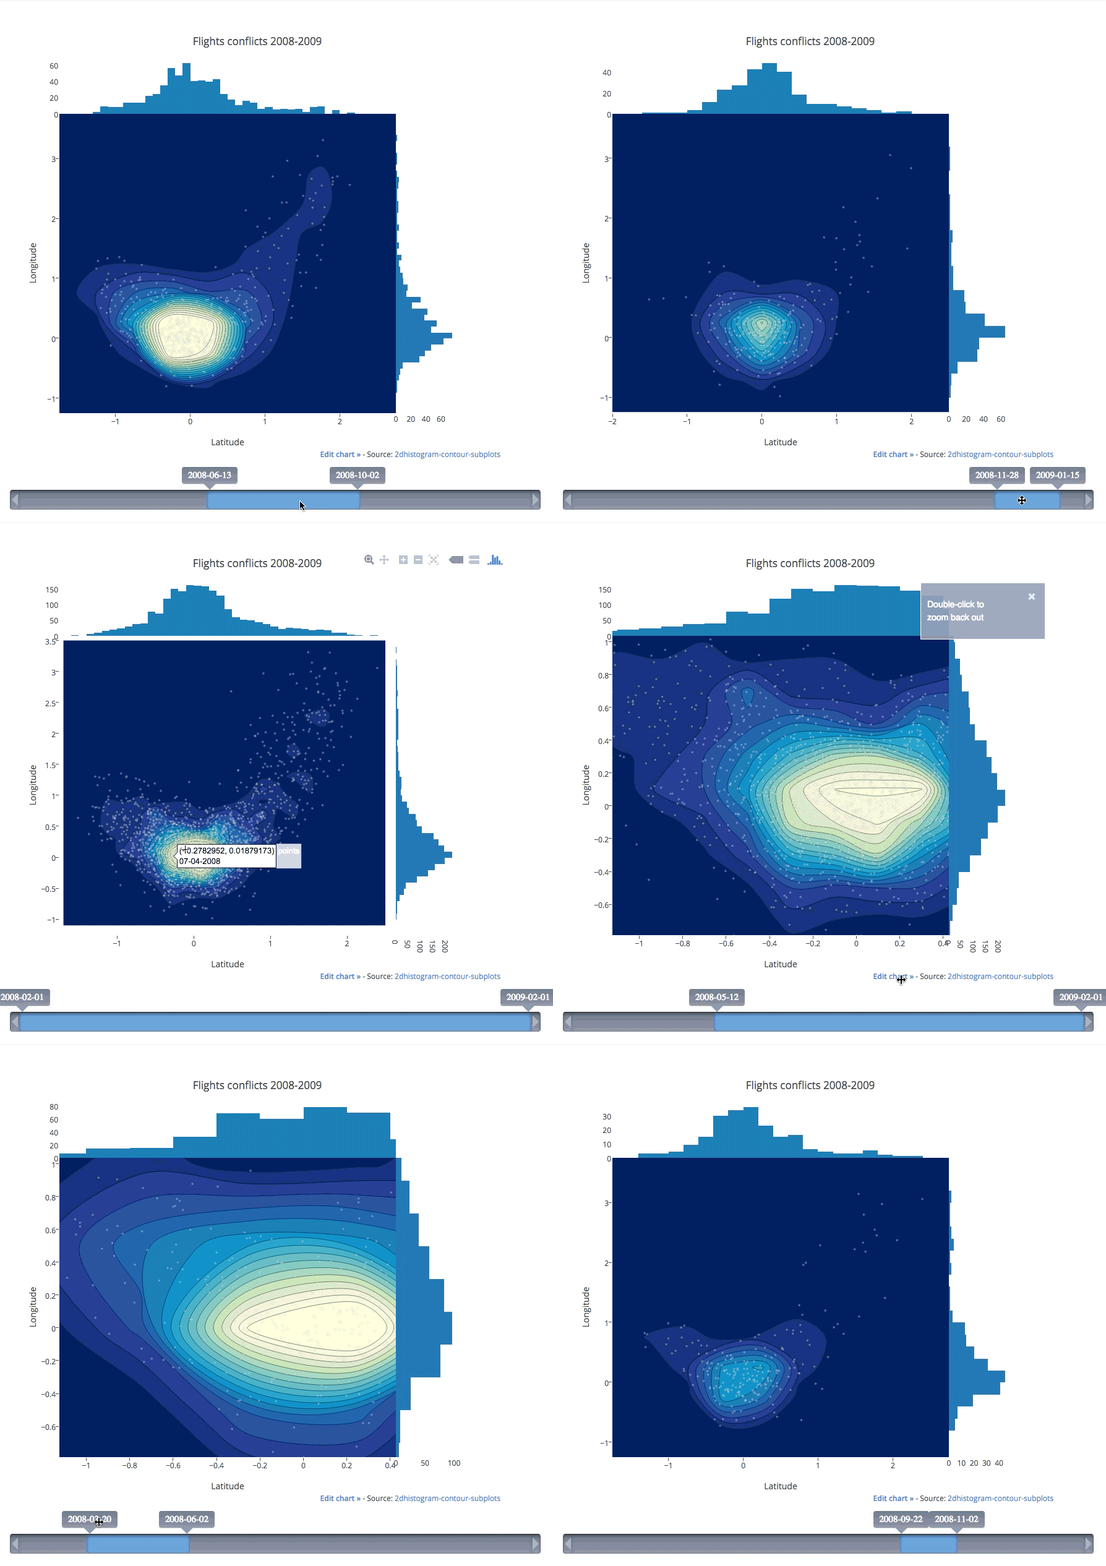
2D Histogram Contour Plot with Slider Control
https://jsfiddle.net/plotlygraphs/y9sdy76h/4/embedded/result,js,html/
Add slider controls to 2d-density-plot plots with the postMessage API.
See the code on JSFiddle.
Watch the 5 second video of how it works:

Reference
```python deletable=true editable=true help(ff.create_2d_density)
```python deletable=true editable=true
from IPython.display import display, HTML

display(HTML('<link href="//fonts.googleapis.com/css?family=Open+Sans:600,400,300,200|Inconsolata|Ubuntu+Mono:400,700" rel="stylesheet" type="text/css" />'))
display(HTML('<link rel="stylesheet" type="text/css" href="http://help.plot.ly/documentation/all_static/css/ipython-notebook-custom.css">'))

! pip install git+https://github.com/plotly/publisher.git --upgrade
import publisher
publisher.publish(
    'density-plots.ipynb', 'python/density-plots/', 'Python 2d Density Plots | plotly',
    'How to make a 2d density plot in python. Examples of density plots with kernel density estimations, custom color-scales, and smoothing.',
    title='Python 2d Density Plots | plotly',
    name='2d Density Plots',
    thumbnail='thumbnail/density.gif', language='python',
    has_thumbnail='true', display_as='statistical', order=7,
    ipynb= '~notebook_demo/25')
```python deletable=true editable=true
```